- TOP
- Sustainability
- Calculating CFP

Sustainability
Calculating CFP
Contents
Summary
- Carbon Footprint of Products (CFP) measures the total volume of greenhouse gases (GHGs) that a product or service has emitted over its entire life cycle from raw-material procurement to disposal or recycling. This volume is converted into an equivalent volume of CO2 emissions that is presented in an easily-understood format for products and services.
- The primary purpose of assessing CFPs is to increase the visibility of CO2 emissions in order to spur progress toward substantive policies for their reduction. In recent years, growing demands for carbon neutrality and decarbonization have made CFP increasingly essential in every industrial sector.
- In July 2021, Asahi Kasei began a collaboration with NTT DATA Group Corporation to develop a platform for assessing CFP for each product grade in our lineup of engineering plastics. We have been providing CFP data to our customers since May 2022.
What is a CFP?
CFP stands for Carbon Footprint of Products. A CFP measures the total volume of greenhouse gases (GHGs) emitted over the entire life cycle of a product or service from raw-material procurement to disposal or recycling. This volume is converted into an equivalent volume of CO2 emissions that is presented in an easily-understood format for products and services.
What is the purpose of assessing CFP?
In recent years, growing demands for carbon neutrality and decarbonization have made CFP increasingly essential in every industrial sector. The primary purpose of assessing CFP is to increase the visibility of CO2 emissions in order to spur progress toward substantive policies to reduce them.
An accurate understanding of the present status of CO2 emissions is a key prerequisite for realizing effective CO2 reduction strategies, which require cooperation from every link of the supply chain. Governments and corporations around the world have begun requesting and, increasingly, demanding estimates of CO2 emissions as a prerequisite for partnerships and deals. Moreover, making CFP data publicly available gives consumers the information they need to reduce or eliminate carbon from their lives themselves.
How are CFP assessed?
CFP are assessed through a multi-step process. The first step is to determine the emissions associated with raw materials, energy sources, and other contributing items by multiplying the total activity (how much of the item was used) by the unit emissions (how much CO2 is emitted by each unit of the item) for each item. Then the CO2 emissions for all of items are summed to yield the final CFP value for the specific product or service.
CFP values are specific to particular products or services and are typically presented in the form of CO2 emissions per individual item or per unit weight (kg) or area (m²).
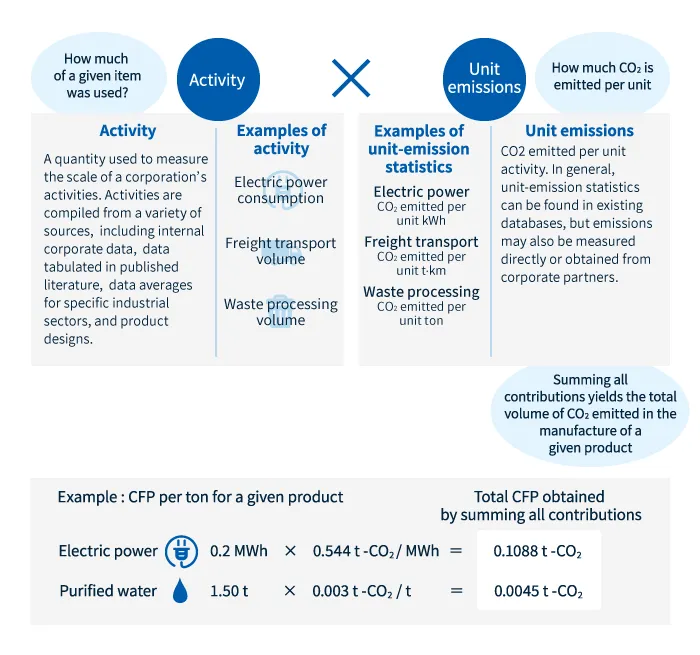
How CFP are assessed (Figure prepared by our company based on data from Japan's Ministry of Economy, Trade and Industry)
■Rules for assessing CFP
CFP are assessed in accordance with the GHG Protocol, an international standard establishing rules for assessing and reporting greenhouse-gas emissions, and with ISO14067, an ISO standard based on the GHG Protocol.
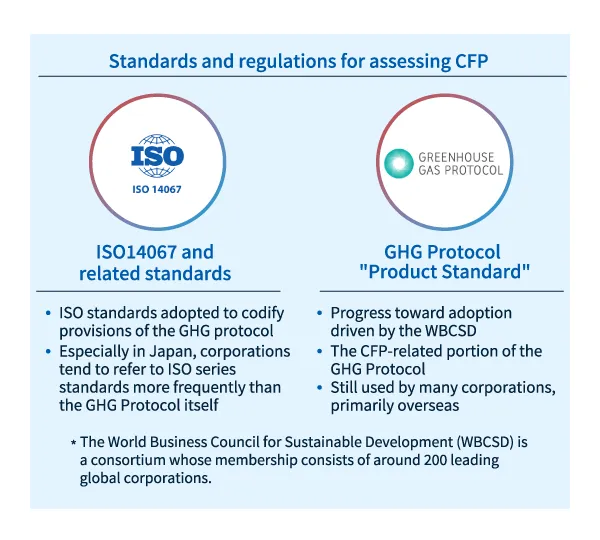
Standards and regulations for assessing CFP
Note that both the GHG Protocol and ISO14067 describe general provisions, with specific assessment techniques for particular situations to be determined by the assessing parties.
■Scope classes for CFP assessments: Covering different stages of the product lifecycle
For some purposes, it is useful to restrict the scope and range of CFP assessments (thus yielding partial CFP). The various CFP scope classes are described below.
Scope classes for CFP assessments
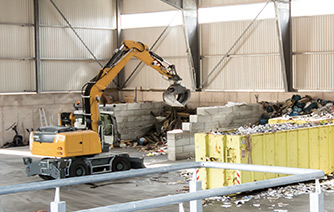
- Gate-to-Gate:This class of CFP focuses only on the product-manufacturing process; it is used to assess the impact of efforts to identify and improve the environmental consequences of production processes. Because gate-to-gate CFP do not account for the environmental consequences of harvesting natural resources or using and discarding products, they cannot provide insight into the full environmental impact of supply chains as a whole, and must thus be used together with other assessment techniques to construct sustainable supply chains.
- Cradle-to-Gate:This class of CFP covers the stages from natural-resource procurement through product production, shipping, and retail sale; it is useful for understanding the environmental impact of raw materials received at production sites. Cradle-to-gate CFP allow the environmental impacts of individual ingredients to be compared—and the consequences of changing ingredients to be evaluated; they are a powerful tool for constructing sustainable supply chains. (This class of CFP does not account for the environmental impact of using and discarding products.)
- Cradle-to-Grave:This class of CFP covers the entire product lifecycle, from harvesting natural resources through using and discarding products.
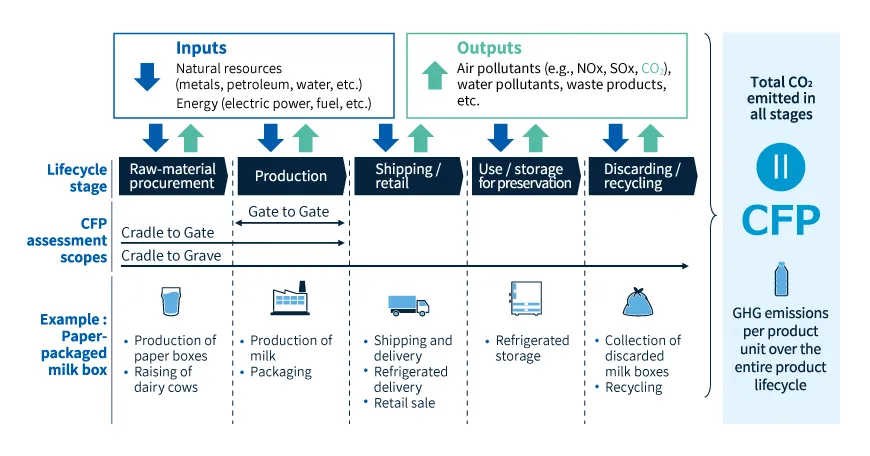
CFP scope classes and the stages of the product lifecycle they cover (Figure prepared by our company based on data from Japan's Ministry of Economy, Trade and Industry)
Column: How CFP assessments differ from GHG protocol scopes (Scope 1, Scope 2, and Scope 3)
Whereas CFP describe the GHG emissions of products, the scopes (Scope 1, Scope 2, and Scope 3) of the GHG protocol assess the GHG emissions of organizations. The GHG protocol classifies greenhouse gas emissions into the following 3 scopes, with emission contributions from all 3 scopes summed to yield total CO2 emissions over the full supply chain.
Scopes in the GHG protocol
- Scope1:Direct greenhouse gas emissions from corporations themselves (through actions such as fuel combustion and the operation of industrial processes)
- Scope2: Indirect emissions associated with the use of electric power, heat, and steam provided by other corporations
- Scope3: Indirect emissions not included in Scope 1 or Scope 2 (emissions by other corporations associated with the activities of the corporation in question)
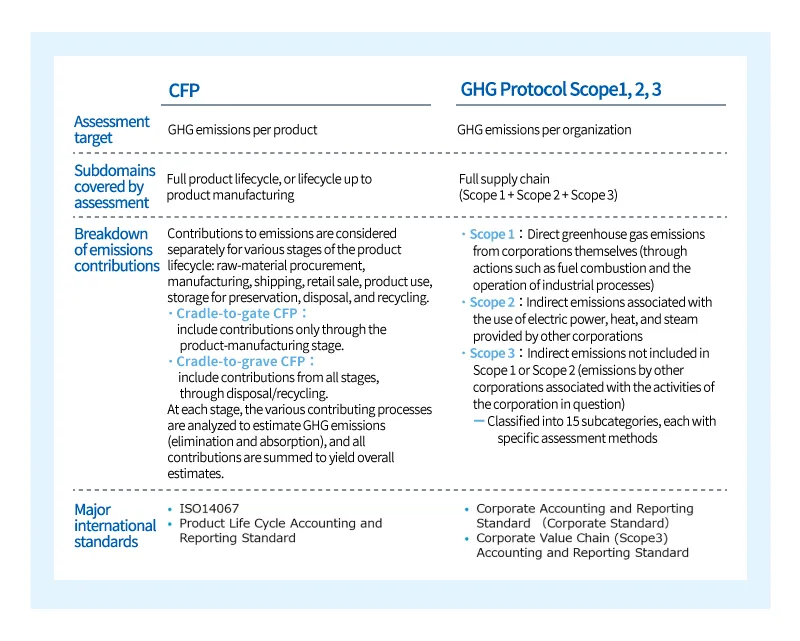
Cross-reference: How CFP relate to GHG protocol scopes (Figure prepared by our company based on data from Japan's Ministry of Economy, Trade and Industry)

Asahi Kasei’s Recommended Solutions
Providing carbon footprint data for each product of engineering plastics
Asahi Kasei has established a platform jointly with NTT DATA Corp. to grasp the amount of GHG emissions and calculate CFP (carbon footprint of products) for each grade of engineering plastics. Use of the Platform began in April 2022, and CFP data provision to customers began in May 2022.
Characteristic 1: Inclusion of GHG emissions from procurement and transportation to outsourced processing, in-house manufacturing, and shipment
The CFP of each material procured from upstream suppliers is added to the GHG emissions calculated proportionally in outsourced processing and in-house manufacturing processes, enabling visualization of CFP inclusive of the supply chain from upstream to manufacturing and shipment. (For calculating the CFP of materials, LCI database “IDEAv2.3” provided by the National Institute of Advanced Industrial Science and Technology (AIST) is used.)
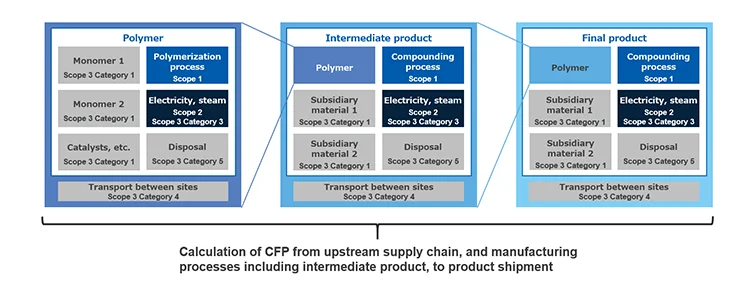
Enabling visualization of CFP inclusive of the supply chain from upstream to manufacturing and shipment
Characteristic 2: Monthly calculation of CFP for each final product is possible even with complex supply chain
Our CFP calculation covers the complex supply chain of Asahi Kasei's engineering plastics, which are characterized by a wide range of grade lineups and global production, and enables us to calculate CFP for each customer by the grade they use.
The characteristics described in 1 and 2 above enable us to provide our customers, such as intermediate product manufacturers, with CFP for each product covering Scope 1, 2, and 3. In addition, by visualizing emissions by product and manufacturing process, it is possible to study effective reduction measures for each manufacturing process.
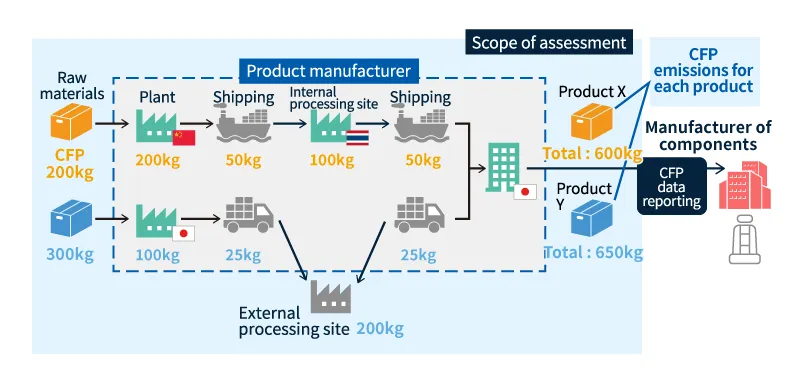
Schematic diagram depicting assessment and reporting of CFP for different final products, taking into account the entire manufacturing process
Characteristic 3: Dual analysis of cost and CFP achieved by combining with management information
As the Platform was created by expanding an existing management information platform, combined analysis of cost and CFP from various perspectives, such as by final product or by customer, is enabled.
Please feel free to contact us with your questions.
Inquiries