- TOP
- Basic Knowledge of CAE Analysis
- Part 6: How to use the results of injection molding analysis
Series: Fundamentals of CAE Analysis for Plastic Product Design
Part 6 How to use the results of injection molding analysis
We will explain the output results of injection molding analysis and how the obtained information can be used in product/mold design and molding process.
Update date:
2023.07.10
|Release date:
2023.07.10
Contents
| 1. Introduction |
| 2. What can an injection molding analysis tell us? |
| 3. How will the analysis results be used? |
| 4. Some of the common molding defects |
| 5. Summary |
Introduction
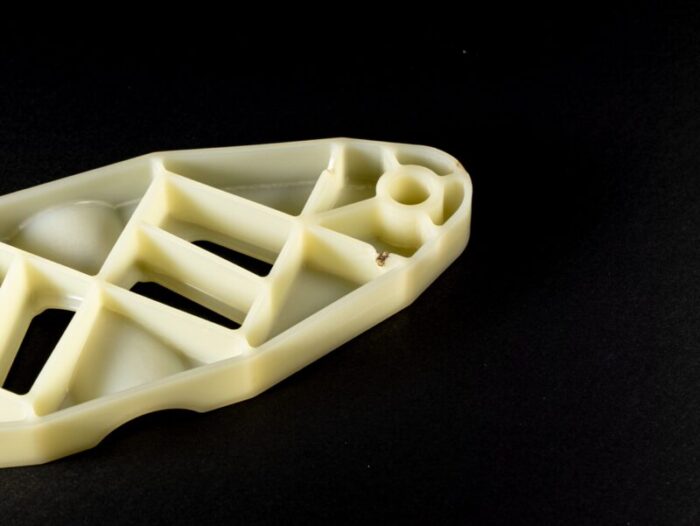
What is the output of a molding simulation based on injection molding analysis? Simulation results are generally presented as animations or contour plots for easy visual understanding. This article introduces the types of output information and how it is utilized in the design and subsequent processes.
What can an injection molding analysis tell us?
Even if it is called injection molding analysis, the analysis to be performed differs depending on what you want to know. There are four main analyses: cooling analysis, filling analysis, holding pressure analysis, and warpage analysis.
Cooling analysis is a heat transfer simulation used to analyze heat flow in an injection mold. It is used to determine the temperature inside the cavity filled with resin, the temperature of the entire mold, and the cooling time.
Filling analysis predicts the flow of resin in the mold during the filling process. The filling analysis calculates the flow front in the mold cavity, which extends progressively from the injection position until the V/P switching position is reached.
Packing analysispredicts the flow of resin in the mold during the packing process. It is possible to check whether the cavity is completely filled with resin by executing in the order of filling analysis and pressure retention analysis.
Warpage analysisidentifies the cause of warpage and considers solutions such as changing gate locations, changing design parameters, and reducing wall thickness variations.
The following output information can be obtained from these analyses.
■ Filling pattern
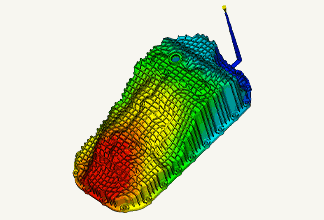
A filling pattern is the result of verifying how resin flows in a molded product by filling analysis. The gate position, resin type, and analysis conditions are set in the mesh model , and the resin filling pattern can be verified. As shown in Figure 1, the gradient shows how the resin is filled through the gate into the model.
Since we know where it takes time for the resin to fill, we can reflect this in the design, for example, by considering appropriate gate locations or changing shapes such as thin-walled sections that are difficult to flow.
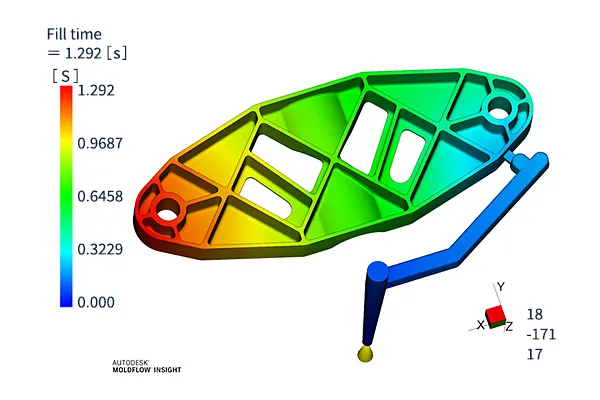 Fig. 1 Filling pattern example
■ Resin pressure distribution at filling completion
Filling analysis can visualize how the pressure inside the cavity is distributed when the cavity is completely filled with resin. Uneven pressure can cause deformation of the molded product. In addition, products that require high pressure may break the mold. Knowing where and how pressure is applied can be utilized in mold design.
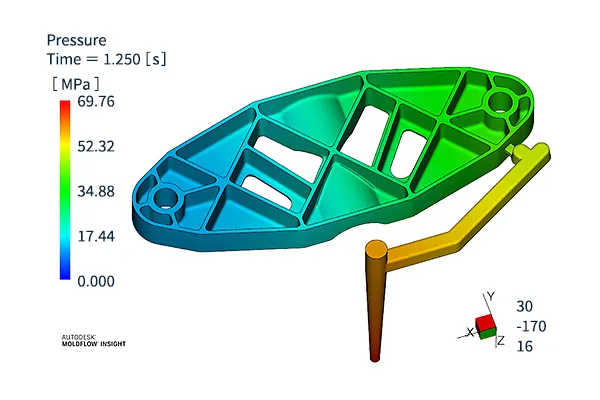 Fig. 2 Example of resin pressure distribution at filling completion
■ Resin temperature distribution at filling completion
This is the result of a cooling and filling analysis simulation of how the resin temperature is distributed when the mold is completely filled with resin. Variations in resin temperature can cause uneven shrinkage and lead to warpage of the molded product. This analysis is used to study cooling efficiency and cooling water pipe arrangement to ensure as uniform cooling as possible.
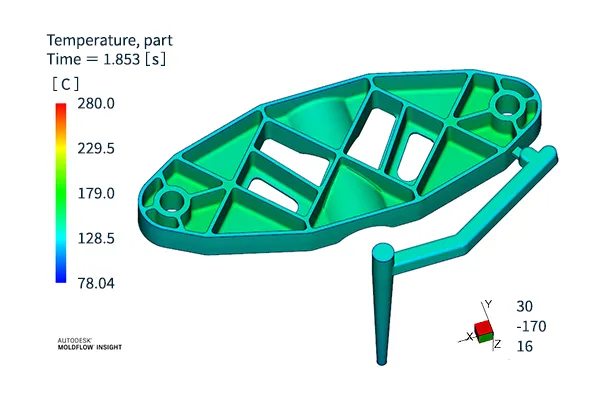 Fig. 3 Example of resin temperature distribution at filling completion
■ Temperature at flow front
Flow front refers to the leading edge of the flow of resin injected into the mold and indicates the temperature at which the resin reaches each part of the molded product. It is calculated in a cooling analysis. The mold is often set at a lower temperature than the molten resin, and the temperature of the resin decreases during the filling process. If the flow front temperature is too low during the filling process, molding defects may result.
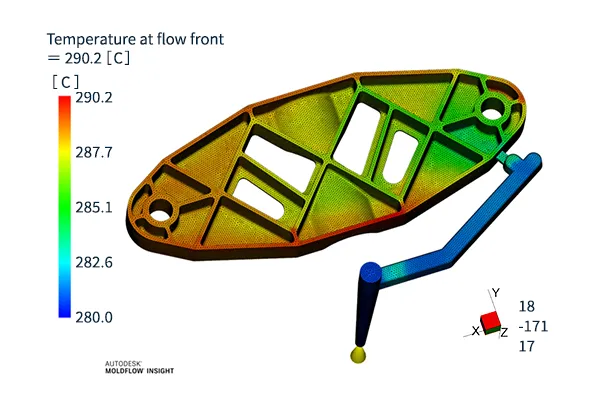 Fig. 4 Example of resin temperature at flow front
■ Mold surface temperature distribution
Temperature distribution on the molded product surface (mold surface) after cooling can be confirmed. This can be used to determine the cause of warpage by checking for uneven cooling and large temperature differences between the fixed and movable sides of the mold.
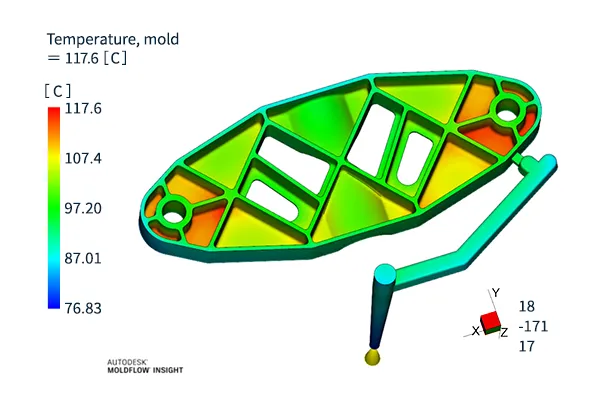 Fig. 5 Example of mold surface temperature distribution


■ Time variation of temperature of each part of the molded product
The temperature variation of each part of the molded product over time is output from the cooling analysis. This analysis checks for temperature deviations such as hot spots and cold spots, which can cause deformation and warpage, and also checks whether the gate solidifies before the molded product. It is also possible to check for uniform cooling.
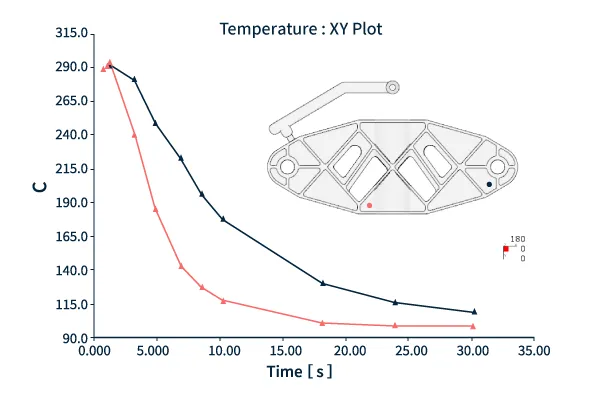 Fig. 6 Example of time variation of temperature of each part of a molded product
■ Time variation of pressure in each part of the molded product
The pressure variation throughout the molded product can be analyzed via filling analysis. Pressure typically starts at 1 atm and increases once the flow front is reached. Pressure increases in areas with restricted flow and flowability differs depending on resin type. This allows for checking whether the resin flow is adequate, and knowing the maximum pressure is useful in selecting the molding machine size.
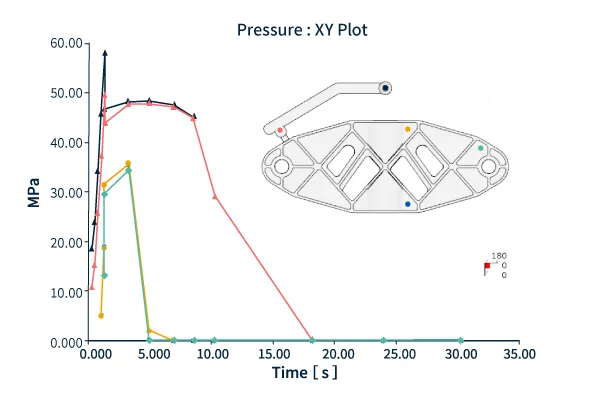 Fig. 7 Example of time variation of pressure in each part of a molded product
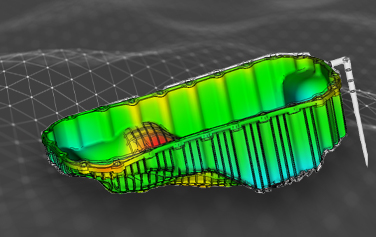
■ Warp deformation
Warpage analysis uses the results of cooling and filling analysis to predict how shrinkage and warpage of the molded product will occur. It also simulates the degree of deformation that will occur. The shape and gate position that minimizes warpage can be considered and reflected in the product design stage.
Warpage deformation occurs when products do not shrink uniformly. There are three main causes of warpage: cooling differences, shrinkage differences, and orientation differences, and Moldlfow outputs information on the main causes by turning on the Specify Cause of Warpage option. Figure 8 shows the result of outputting information on all factors.
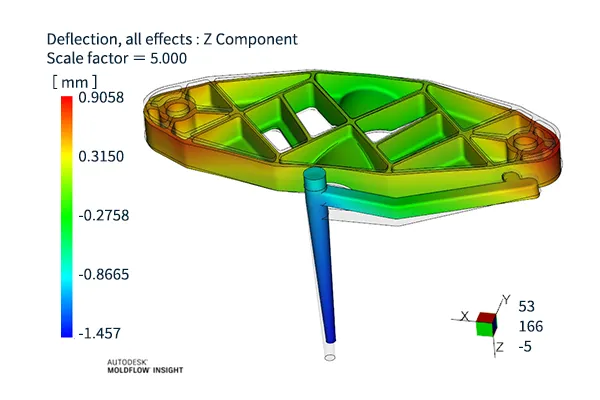 Fig. 8 Example of warp deformation
■ Pressure at V/P switchover
V/P switchover refers to the changeover from the injection process (Velocity control) to the pressure holding process (Pressure control) when molten resin is injected into the mold by the screw.
The pressure at V/P switchover indicates how far the resin is filled during the velocity-controlled filling process. During the velocity control process, the cavity should not be completely filled with resin, and the unfilled areas are completely refilled by the pressure control. If the holding pressure at this time is too low, it may cause sink marks, and if it is too high, it may cause burrs and mold breakage.
Appropriate molding conditions are obtained by analyzing with filling analysis.
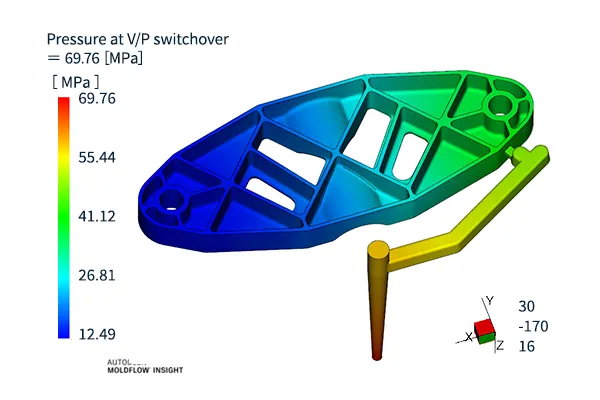 Fig. 9 Example of pressure at V/P switchover
■ Pressure at injection location
Analyzes the time variation of pressure in each part of the molded product during the filling and pressure holding processes. If there is uneven pressure in a particular part of the molded product or in some parts of the molded product in a multi-cavity molding process, there may be a flow imbalance. Check for flow problems and proper pressure retention.
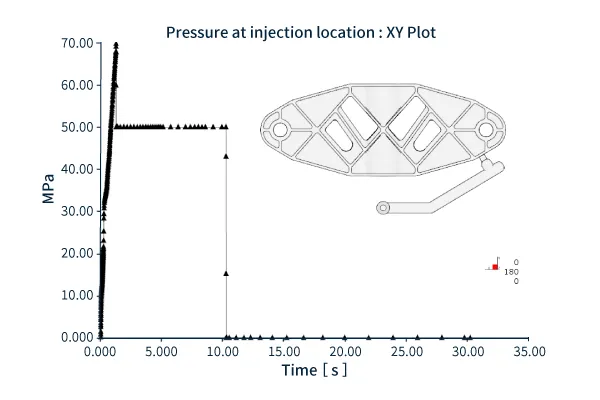 Fig. 10 Example of pressure at injection location
■ Mold clamping force
Mold clamping force is the amount of force required to keep the mold tight when filling with resin. The appropriate value is obtained from the pressure distribution throughout the molded product. Based on the mold clamping force required for molding, it is necessary to select an appropriately sized molding machine.
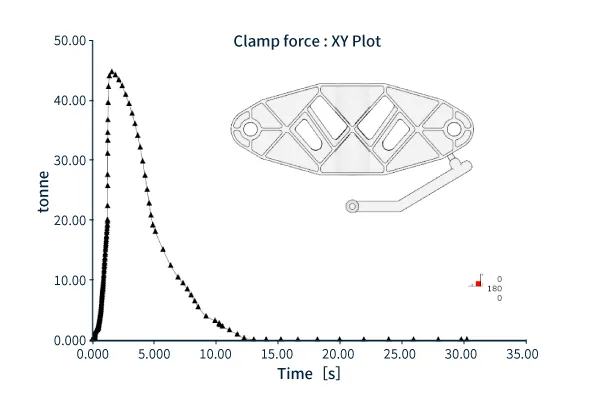 Fig. 11 Example of mold clamping force
■ Fiber orientation tensor
In resins containing glass fibers, fiber orientation can cause problems such as uneven shrinkage and weak strength in some directions. In the case of fiber-reinforced resins, fiber orientation analysis can be used to determine the fiber orientation and orientation tensor (degree of orientation) after the molding process is complete. In order to take advantage of the properties of fiber-reinforced resins, it is important to understand the orientation trends in advance.
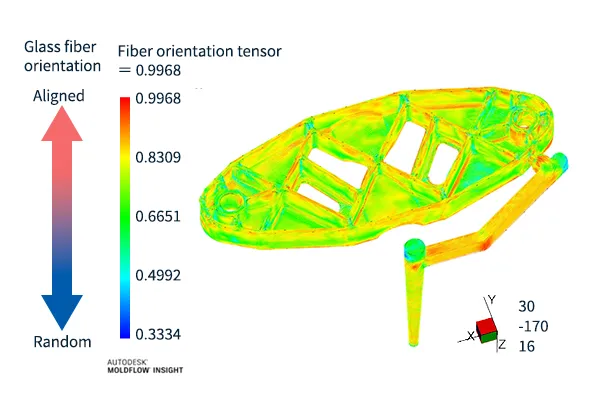 Fig. 12 Example of fiber orientation tensor
■ Sink marks estimate
Based on filling analysis and pressure retention analysis, we can predict where sink marks are likely to appear in a molded product and their depth. Hiccups usually occur on the opposite side of molded product thick walls, ribs, bosses, and internal fillets. By analyzing different molding conditions such as shape, gate position, mold and resin temperature reduction, the cause of sink marks can be identified and countermeasures can be taken.
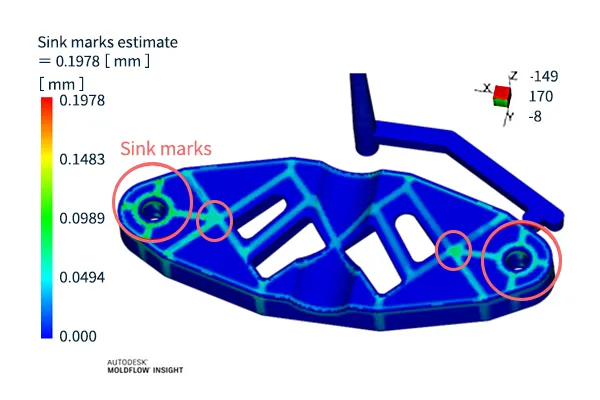 Fig. 13 Example of sink mark prediction
■ Weld line estimate
Filling analysis predicts where weld lines will occur. Weld lines appear where resin meets resin. Since weld lines can cause lack of strength and appearance defects, they can be made less noticeable by adjusting the gate position to a location that is less visible from the outside, or by moderating the meeting angle (the angle at which the resin collides with the resin).
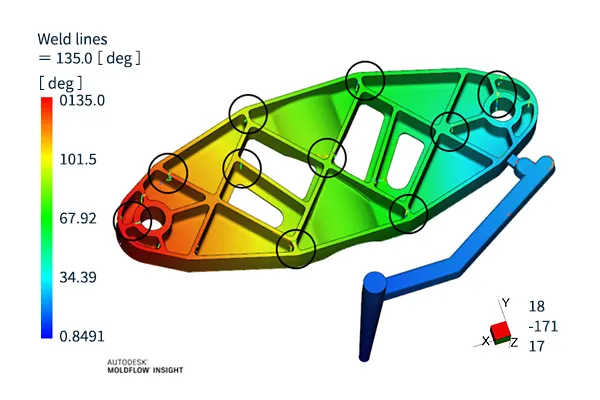 Fig. 14 Weld line prediction example


How will the analysis results be used?
We will explain how the information obtained from injection molding analysis can be applied to product/mold design and molding processes. Analysis data can be used to obtain rational and objective indicators in situations where judgment is required.
■ Size of molding machine required
In order to know the appropriate molding machine size, it is important to know the appropriate magnitude of mold clamping force, injection pressure, etc. By using injection molding analysis, those values can be known and the size of the molding machine can be considered in advance. The size of the molding machine is directly related to the molding schedule and cost, so it is necessary for production planning.
■ Determination of liquidity
Based on the filling pattern, pressure, resin temperature, and other factors, we check whether the molded product can be filled with resin without excess or deficiency. We contribute to reducing problems during the molding stage by studying and taking countermeasures in advance, such as adjusting thin-walled areas or runners that are difficult to flow or changing the type of resin.
■ optimal of gate location
Based on the filling pattern, weld, etc., we verify which gate position will facilitate molding and prevent defects from occurring. It is also important to check whether changing the gate position will not cause other problems and to determine the optimal position by prioritizing and judging.
■ optimal of molding conditions
Optimal molding conditions are derived from V/P switching pressure, injection position, mold temperature, and cooling rate. Setting molding conditions requires experience and knowledge, so it is often left to the skill of the molding engineer.
■ optimal of mold cooling
Based on the mold temperature distribution and temperature variation over time, the water pipe position and cooling water temperature are adjusted to cool the mold as evenly as possible. Proper cooling is important because insufficient or uneven cooling may cause molding defects. If molding problems occur after production has started, it is difficult to make major changes to the mold, such as changing the water tubes, so it is important to fully consider and take countermeasures in advance.
■ Improvement of warp deformation by the above optimization
Uneven pressure, uneven cooling, and fiber orientation can cause warpage in molded products. Especially for products that require strict dimensional accuracy, injection molding analysis can be used to verify as much as possible in advance and countermeasures can be taken to minimize deformation.
Some of the common molding defects
Injection molding analysis can be used to predict possible molding defects and failures. Molding defects are an unavoidable problem in mass-production molding, and injection molding analysis can help minimize their occurrence. Some of the common molding defects are listed below.
■ Short shots
Short shots refers to a molding defect in which the melted resin does not completely fill the tip of the mold. Molded products with short shots cannot be recovered. Short shots are caused by insufficient resin flow, insufficient injection pressure, or insufficient holding pressure. Control the occurrence by adjusting the V/P switching pressure position, injection pressure, and gate position.
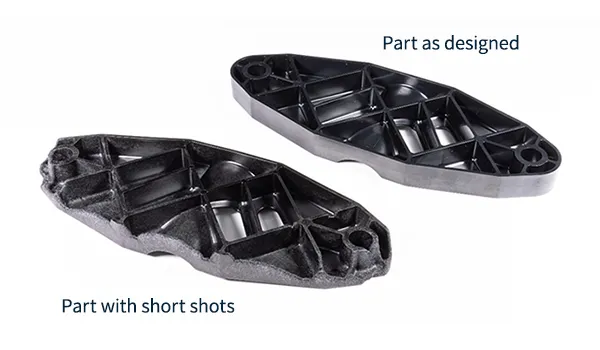 Fig. 15 Example of short shots
■ Weld lines
The confluence of molten resin filled into a molded product may form a thin scratch-like line, which is called a weld line. These weld lines are weak and may be damaged during strength tests. They may also look like scratches on the exterior, which may lead to consumer complaints. Countermeasures include changing the gate position so that the weld lines do not appear in prominent areas, adjusting the mold temperature, and adjusting the thickness of the molded product to control the meeting angle between two melt fronts. .
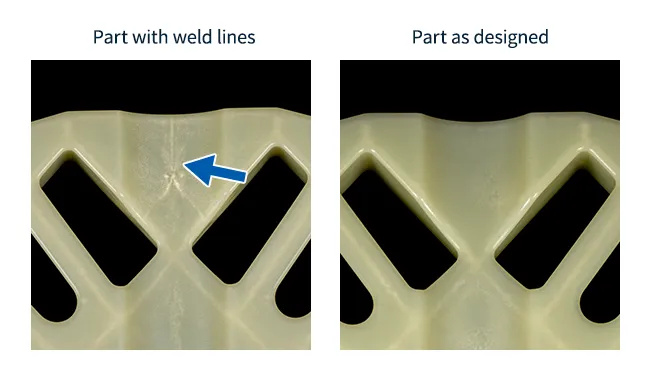 Fig. 16
Example of weld lines
Fig. 16
Example of weld lines
■ Burn marks
Burn marks are a phenomenon in which a portion of a molded product burns and turns black and carbonized. This occurs when the molten resin is injected at high pressure, causing the air in the cavity to lose its place and become compressed, generating high heat. Burn marks tend to occur not in the early stages of molding, but when mass production gets underway, and the molding process is often troubled by the need to prevent burn marks. In addition to reducing the injection speed, it is effective to provide air vents to release gas and to control resin flow by changing the gate position and wall thickness.
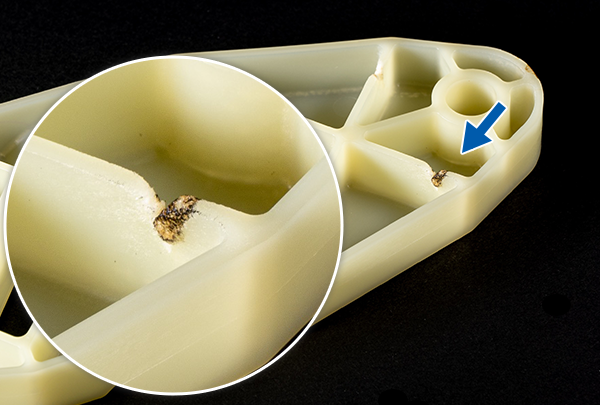 Fig. 17 Example of burn marks
■ Sink marks
Sink marks are a type of defect in appearance and are caused by differences in shrinkage rates at different parts of the molded product, such as different wall thicknesses. This can be addressed by adjusting gate positions, increasing injection pressure, cooling efficiency, and adjusting wall thickness. Since this defect tends to occur in thicker sections such as ribs and bosses, it is important to take countermeasures at the design stage.
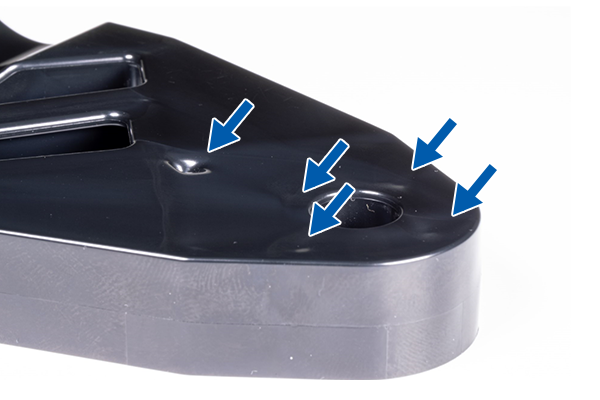 Fig. 18 Example of sink marks
Summary
It is important to simulate and take countermeasures against possible problems in the molding process during the product design and die design stages. For this purpose, designers also need to be knowledgeable about molding. Designing with moldability in mind will reduce rework and directly lead to shorter development times. Not all molding problems can be eliminated in the molding process alone. It is necessary to take countermeasures from the design stage, learn how to use CAE simulation results, and make the best use of them in your design.
Next Part: "Prediction of molding defects"


For more information about CAE, please contact us.
Easy to find on Google
Adding this site as a preferred source in Google search results will make it easier to find articles from Asahi Kasei engineering plastics Comprehensive Information Site.

Others


Related Information